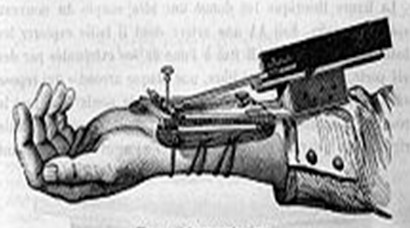
 Since ancient times, pulse researchers have been trying to record pulse waves on some medium for study.
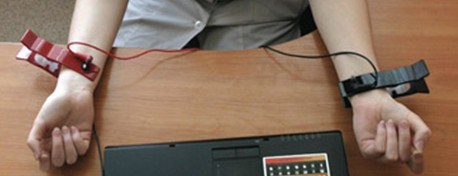 Currently, various devices and sensors are used to record the pulse. The method of electrocardiography, with the use of electrical contacts and recording of skin bioelectric potentials, has become widespread. These devices are used to assess heart rate variability.
  LifePulsAS hardware and software package is designed to assess the patient's health status by complex analysis of pulse waves of capillary blood filling. Designed for rapid studies
of pulsations recorded by a special sensor and subsequent analysis of heart rate variability parameters, taking into account changes in the amplitude of pulse waves .
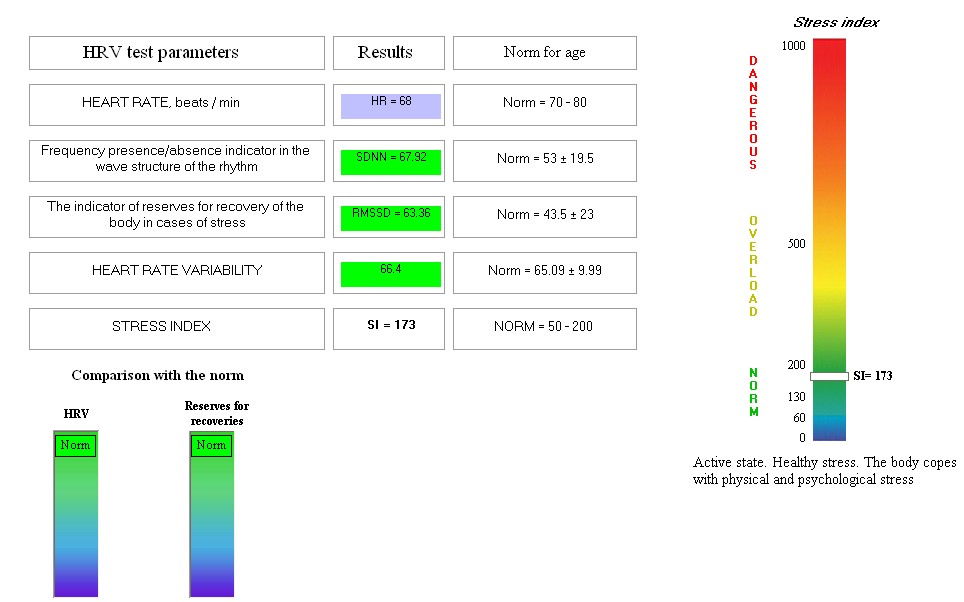
The result of the analysis is an assessment of the patient's condition both in accordance with the methods of the pulse variability test and in accordance with the philosophy of Ayurveda.
LifePulsAS hardware and software package is designed to assess the patient's health status by complex analysis of pulse waves of capillary blood filling. Designed for rapid studies
of pulsations recorded by a special sensor and subsequent analysis of heart rate variability parameters, taking into account changes in the amplitude of pulse waves .
The result of the analysis is an assessment of the patient's condition both in accordance with the methods of the pulse variability test and in accordance with the philosophy of Ayurveda.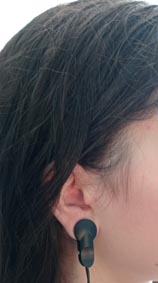 As the primary information in this system, the parameters of the real pulse wave of the peripheral pulse are used, and not the pulses of electrical excitation of the heart.
Thus, pulse waves are studied, which propagate after the end of electrical impulses of excitation of the heart and the release of blood into the cardiovascular system of the body.
This method more fully corresponds of the concepts of Oriental medicine.At the same time, this method allows we to use the entire mathematical apparatus developed to assess the variability
of the heart rate using electrocardio monitoring and provides additional information about the change in the amplitude of the pulse wave depending on the state of the body, under the influence
of internal and external factors.
As the primary information in this system, the parameters of the real pulse wave of the peripheral pulse are used, and not the pulses of electrical excitation of the heart.
Thus, pulse waves are studied, which propagate after the end of electrical impulses of excitation of the heart and the release of blood into the cardiovascular system of the body.
This method more fully corresponds of the concepts of Oriental medicine.At the same time, this method allows we to use the entire mathematical apparatus developed to assess the variability
of the heart rate using electrocardio monitoring and provides additional information about the change in the amplitude of the pulse wave depending on the state of the body, under the influence
of internal and external factors.
 The analysis and evaluation of pulsograms of capillary blood filling is done using standard methods of the pulse variability test.
The subsequent interpretation of the results of the pulse variability test is based on the polyvagal theory (the evolutionary
theory of the vagus nerve). This allows to proceed to the assessment of the patient's condition from the point of view of the
concepts of Ayurveda.
The analysis and evaluation of pulsograms of capillary blood filling is done using standard methods of the pulse variability test.
The subsequent interpretation of the results of the pulse variability test is based on the polyvagal theory (the evolutionary
theory of the vagus nerve). This allows to proceed to the assessment of the patient's condition from the point of view of the
concepts of Ayurveda. 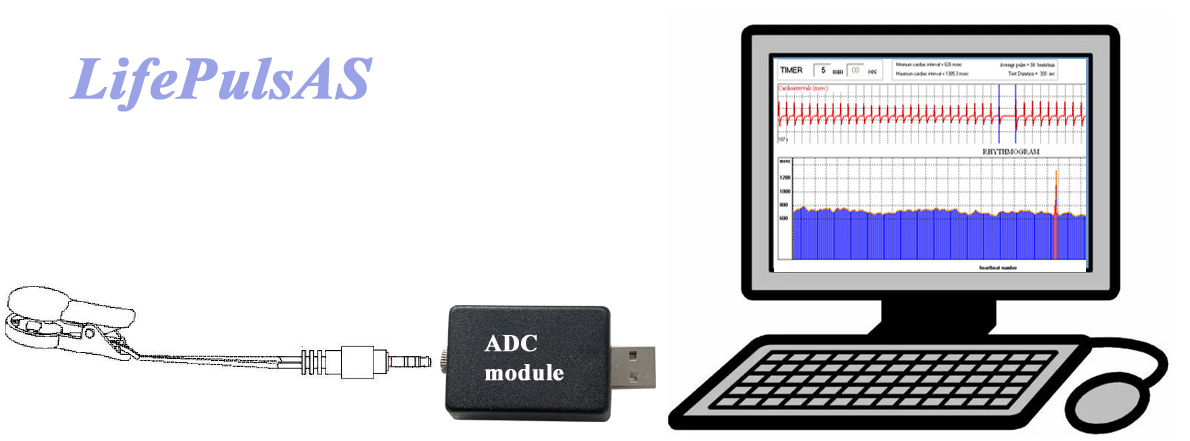 The primary information is generated by the pulse sensor from the patient. Structurally, the sensor consists of two parts -
a clip with a photometric sensor, which is put on the earlobe and connected to the second part, which is an analog signal
converter, which in turn transmits information to the USB connector of the computer. At the same time, the objectivity and
reliability of
the information received is ensured by stabilizing the supply voltage of the sensor, by not changing the
clamping force of the earlobe and using special circuit solutions in the electronic part of the device. In particular,
the analog signal conversion module contains filters, an amplifier, an analog-to-digital converter that forms a stream
of information for transmission to a computer via usb protocol. At the same time, the device records a pulse wave that
has spread through the human body and has been influenced by the functional systems of the body. The parameters of the
pulse wave after the completion of the action of an electric exciting pulse on the heart and receiving additional informational
influence in the process of passing through the vessels and tissues of the body are investigated. This is consistent with the
method of pulse diagnostics of oriental medicine, where the peripheral pulse removed from the heart is examined. The software
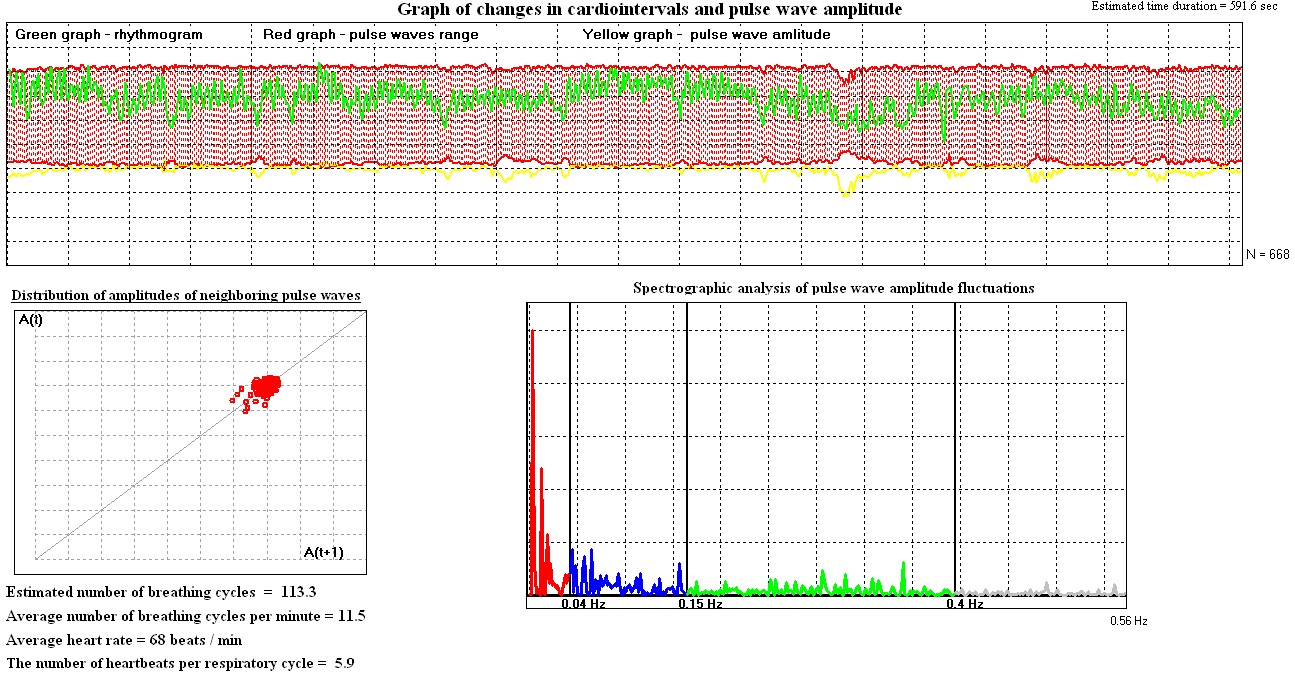
allows you to display pulsograms on the screen in the form of pulse wave bursts. The time interval between heartbeats, as
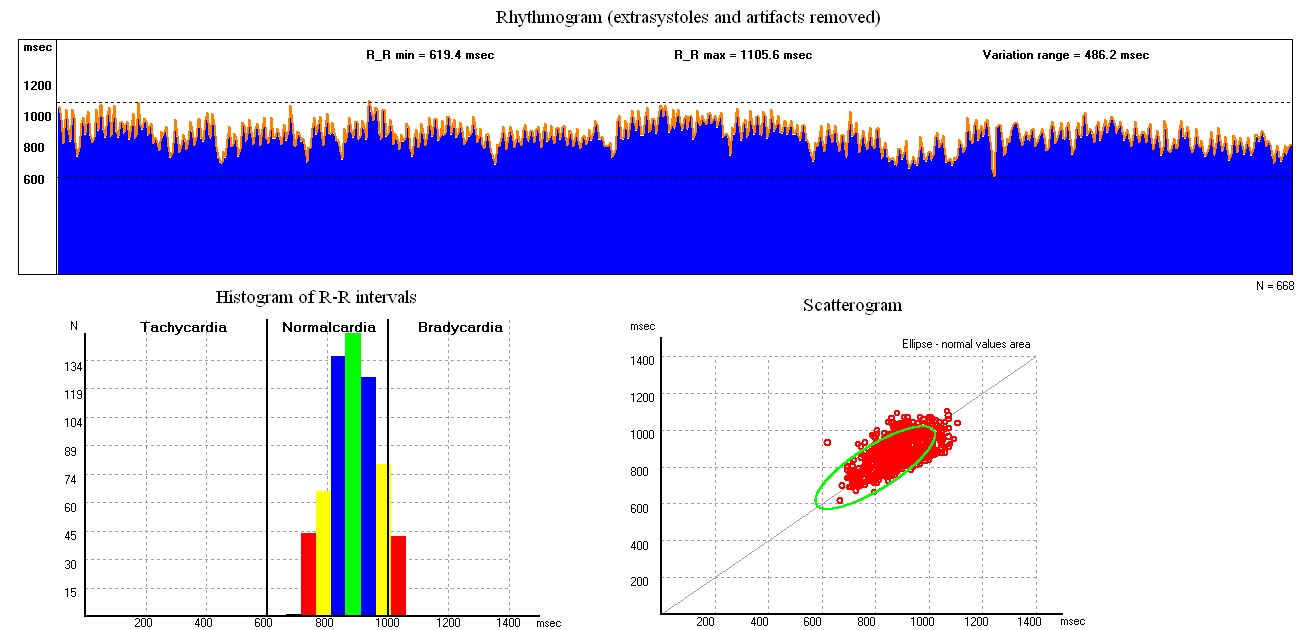
well as their amplitude, is measured in real time. The analysis and processing of the pulse recording results is carried out
in accordance with generally recognized methods, with the involvement of a standard mathematical apparatus for assessing heart
rate variability. This takes into account the gender of the patient - male or female and the age of the patient. In addition,
it is possible to connect a correction module to account for the patient's body type and temperament. The registry module is
used to store the data of the conducted research.
The primary information is generated by the pulse sensor from the patient. Structurally, the sensor consists of two parts -
a clip with a photometric sensor, which is put on the earlobe and connected to the second part, which is an analog signal
converter, which in turn transmits information to the USB connector of the computer. At the same time, the objectivity and
reliability of
the information received is ensured by stabilizing the supply voltage of the sensor, by not changing the
clamping force of the earlobe and using special circuit solutions in the electronic part of the device. In particular,
the analog signal conversion module contains filters, an amplifier, an analog-to-digital converter that forms a stream
of information for transmission to a computer via usb protocol. At the same time, the device records a pulse wave that
has spread through the human body and has been influenced by the functional systems of the body. The parameters of the
pulse wave after the completion of the action of an electric exciting pulse on the heart and receiving additional informational
influence in the process of passing through the vessels and tissues of the body are investigated. This is consistent with the
method of pulse diagnostics of oriental medicine, where the peripheral pulse removed from the heart is examined. The software
allows you to display pulsograms on the screen in the form of pulse wave bursts. The time interval between heartbeats, as
well as their amplitude, is measured in real time. The analysis and processing of the pulse recording results is carried out
in accordance with generally recognized methods, with the involvement of a standard mathematical apparatus for assessing heart
rate variability. This takes into account the gender of the patient - male or female and the age of the patient. In addition,
it is possible to connect a correction module to account for the patient's body type and temperament. The registry module is
used to store the data of the conducted research. Based on the polyvagal theory and the study of the conduction of nerve fibers, during the innervation of individual organs
of the abdominal and thoracic cavity, as well as muscles and glands of the head, it can be concluded that there is a certain
relationship between the frequency ranges, as well as the amplitudes of heart beats with the activation of the branches of
the vagus nerve, along with the influence of the sympathetic nervous system on the heart.
Studies have revealed that the dorsal unmyelized branch of the vagus nerve, consisting of thick fibers, is designed to transmit
impulses with a very low frequency and affect hollow organs and tissues located below the diaphragm. The ventral myelized branch
of the mammalian vagus nerve is capable of conducting signals with a high frequency to affect organs and tissues located above
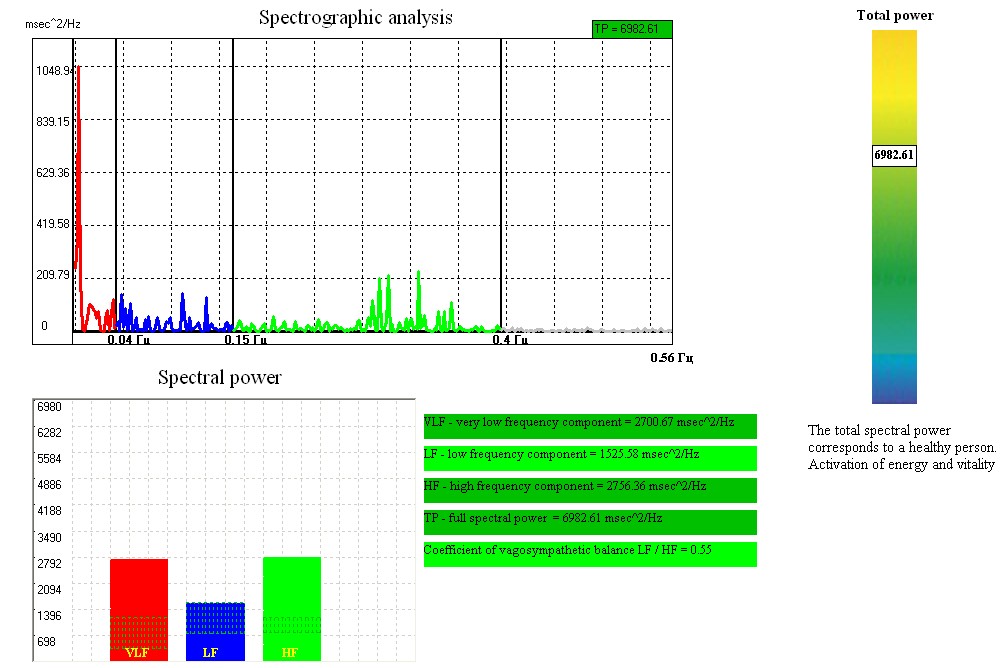
the diaphragm and in the facial part. Studies of spectral analysis and the spectrum of the envelope of rhythmograms allow us to
conclude that different frequency ranges of the heart work correspond to different degrees of exposure of individual parts of the
autonomic nervous system. The frequency spectrum of changes in cardiointervals can mainly be represented as the result of the
control action of the sympathetic nervous system and the separate two branches of the parasympathetic nervous system. The range
of very low frequency, when slowly varying waves of the amplitude of the rhythmogram are present, mainly corresponds to the
influence of the dorsal branch of the vagus nerve. With the predominance of these frequencies, cardiointervals change very slowly,
the heart works very rhythmically and does not correspond to the normal mode of healthy adaptively changing heart function. With a
lot of stress and danger, the heart may freeze and the rate of contraction becomes low. This corresponds to a state of stupor and
immobility. The amplitude of cardiac emissions in the blood decreases, prolonged stay in this state is dangerous for humans. If
there is no immediate danger, then the heart rate may be normal or even higher. At the same time, the state of the body corresponds
to the definition of "digest", however, stress stress may persist. The low frequency range, when faster waves of changes in the
rhythmogram and heartbeat amplitudes appear, corresponds to the state under the activating action of the sympathetic nervous system
"run or fight", as well as "act or play". the high frequency range, when the rhythmogram is saturated with rapidly changing waves,
mainly corresponds to the influence of the ventral branch of the vagus nerve. the heart adaptively and quickly
changes cardiointervals. This corresponds to a state of increased sociability, readiness to act together and provide assistance
if necessary, in the presence of any threat, and a state of lightness, friendliness and calmness, in the absence of danger.
Based on the polyvagal theory and the study of the conduction of nerve fibers, during the innervation of individual organs
of the abdominal and thoracic cavity, as well as muscles and glands of the head, it can be concluded that there is a certain
relationship between the frequency ranges, as well as the amplitudes of heart beats with the activation of the branches of
the vagus nerve, along with the influence of the sympathetic nervous system on the heart.
Studies have revealed that the dorsal unmyelized branch of the vagus nerve, consisting of thick fibers, is designed to transmit
impulses with a very low frequency and affect hollow organs and tissues located below the diaphragm. The ventral myelized branch
of the mammalian vagus nerve is capable of conducting signals with a high frequency to affect organs and tissues located above
the diaphragm and in the facial part. Studies of spectral analysis and the spectrum of the envelope of rhythmograms allow us to
conclude that different frequency ranges of the heart work correspond to different degrees of exposure of individual parts of the
autonomic nervous system. The frequency spectrum of changes in cardiointervals can mainly be represented as the result of the
control action of the sympathetic nervous system and the separate two branches of the parasympathetic nervous system. The range
of very low frequency, when slowly varying waves of the amplitude of the rhythmogram are present, mainly corresponds to the
influence of the dorsal branch of the vagus nerve. With the predominance of these frequencies, cardiointervals change very slowly,
the heart works very rhythmically and does not correspond to the normal mode of healthy adaptively changing heart function. With a
lot of stress and danger, the heart may freeze and the rate of contraction becomes low. This corresponds to a state of stupor and
immobility. The amplitude of cardiac emissions in the blood decreases, prolonged stay in this state is dangerous for humans. If
there is no immediate danger, then the heart rate may be normal or even higher. At the same time, the state of the body corresponds
to the definition of "digest", however, stress stress may persist. The low frequency range, when faster waves of changes in the
rhythmogram and heartbeat amplitudes appear, corresponds to the state under the activating action of the sympathetic nervous system
"run or fight", as well as "act or play". the high frequency range, when the rhythmogram is saturated with rapidly changing waves,
mainly corresponds to the influence of the ventral branch of the vagus nerve. the heart adaptively and quickly
changes cardiointervals. This corresponds to a state of increased sociability, readiness to act together and provide assistance
if necessary, in the presence of any threat, and a state of lightness, friendliness and calmness, in the absence of danger.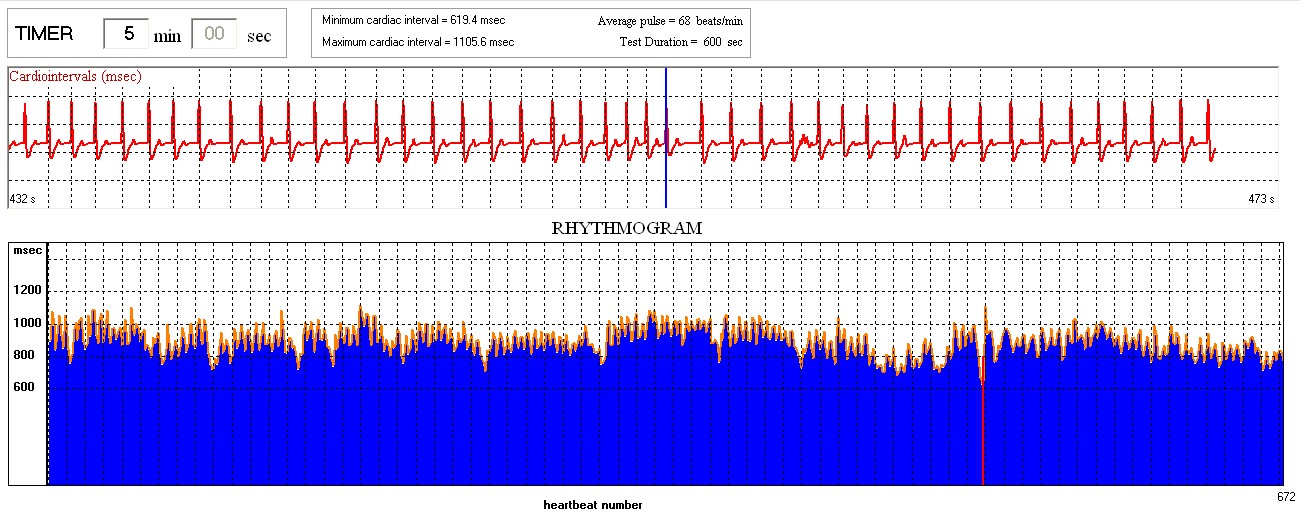
 \
\ \
\
The rhythmogram of the heart with controlled breathing will be presented on the screen.
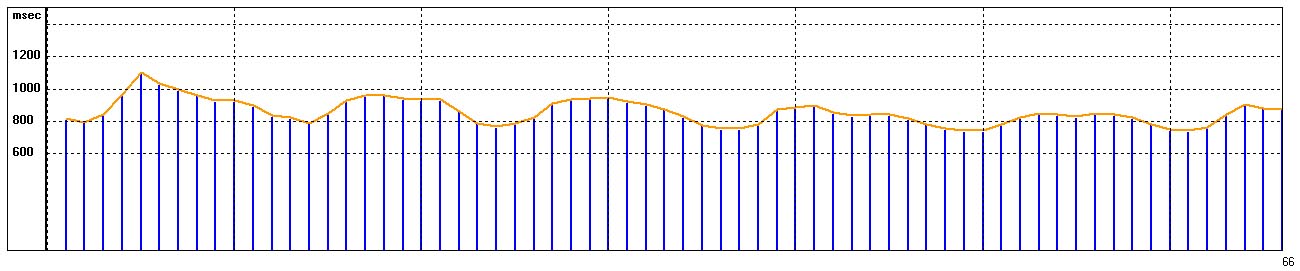
Example of a report of respiratory test results:
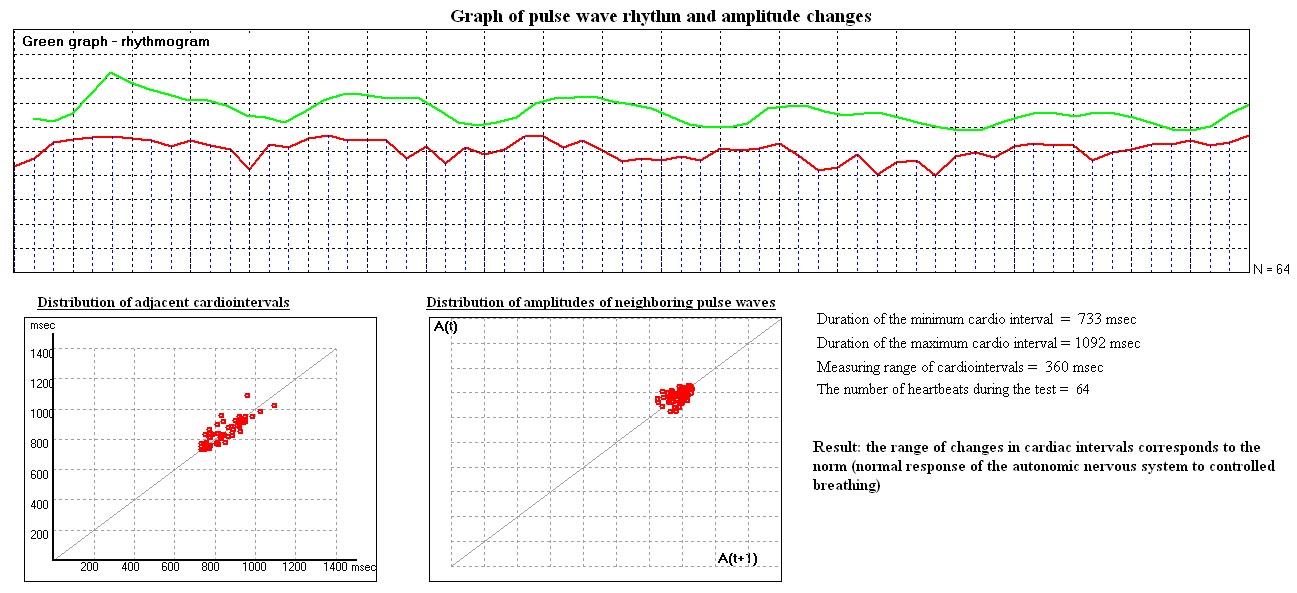
The result of the test is an assessment of the reaction of the autonomic nervous system to controlled breathing in comparison with the norm.
BIOFEEDBACK MODULE
The biofeedback method is an arbitrary volitional control of body functions in order to improve them normally and correct pathology by means of electronic devices that register and transform information about the state of human organs and systems into visual and auditory signals accessible to consciousness.
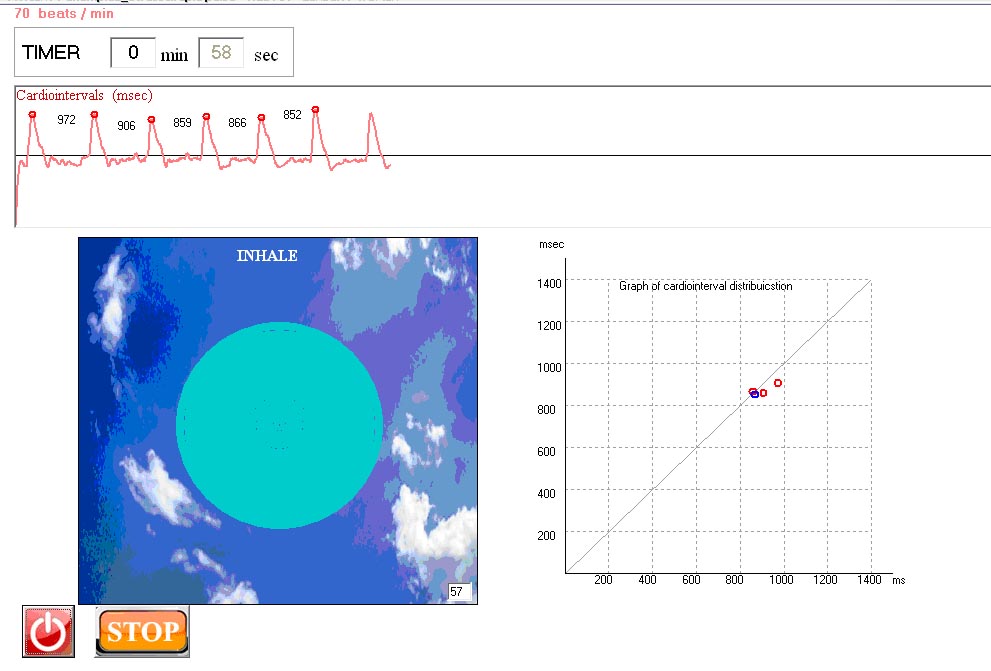
Activation of the biofeedback module (biofeedback) is performed by pressing the corresponding menu item in the Recorder window. This leads to the opening of the module tab. The algorithm of the module is organized in such a way that the patient can observe the occurrence of a pulse wave, hear a sound signal, the tonality of which depends on the frequency of the heartbeat, as well as observe the movements of a red ball on a tricolor field. The location of this ball on the vertical axis depends on the magnitude of the cardiointerval between the two heartbeats of the patient in real time. The green color of the field corresponds to the range of the norm (depending on the age and gender of the patient). Pink color corresponds to a range exceeding the norm, blue color corresponds to a range below the norm.
The working window of the biofeedback module
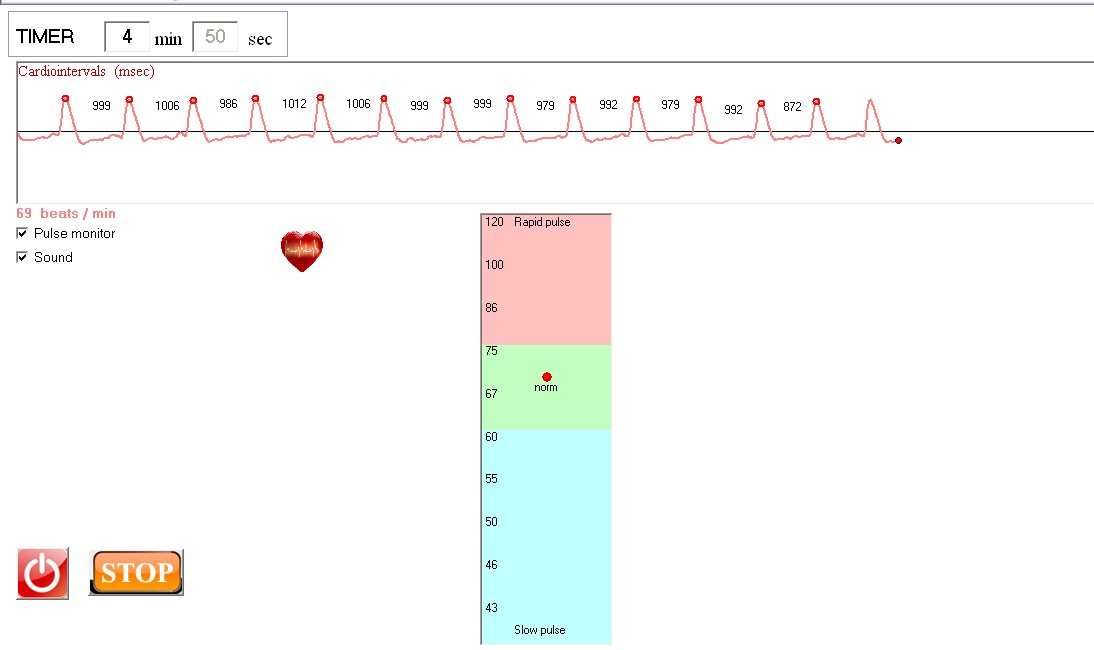
During the session, the patient sees and hears how his cardiovascular and respiratory systems work. The computer module converts changes in the work of the heart into visible and audible feedback signals. When inhaling, the heart rate increases – the red ball on the tricolor field moves up, the tone of the sound increases. When exhaling, the heart rate decreases- the red ball on the tricolor field moves down, the tone of the sound decreases. Volitional control of the movement of the ball allows you to form a type of breathing with synchronization of the phases of breathing and the work of the heart. Conscious management of diaphragmatic relaxation breathing with the help of biofeedback has a healing effect on respiratory, cardiovascular and nervous systems of the body.
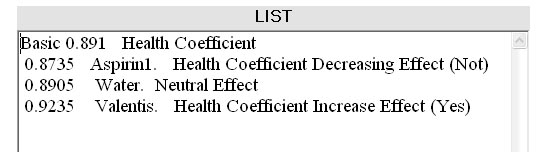
DRUGS SELECT TEST
The test is based on a homeopathic method of determining the sensitivity of the body to drugs by changing the characteristics of the pulse wave. The method allows you to objectively determine the sensitivity of the human body to drugs before their introduction into the body, that is, to predict the result of therapeutic effects.
In contrast to the subjective methods of the "muscle ring test" or kinesiological testing for the selection of drugs, the test uses an objective instrumental method for assessing changes in the patient's condition.
Example. Drug select test result:
RESULTS BY AYURVEDA
GUNAS
Gunas are one of the main concepts in Ayurveda. Gunas describe the features of the human condition.
An example of displaying the Guna tab is shown below:
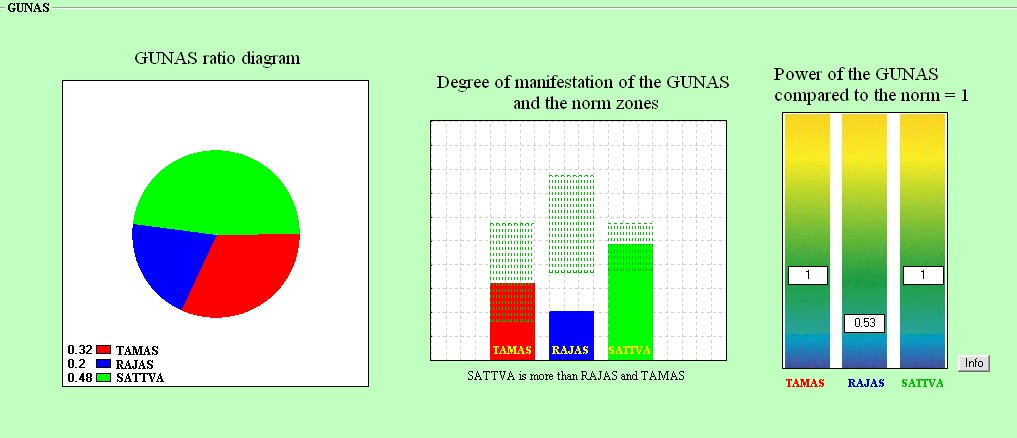
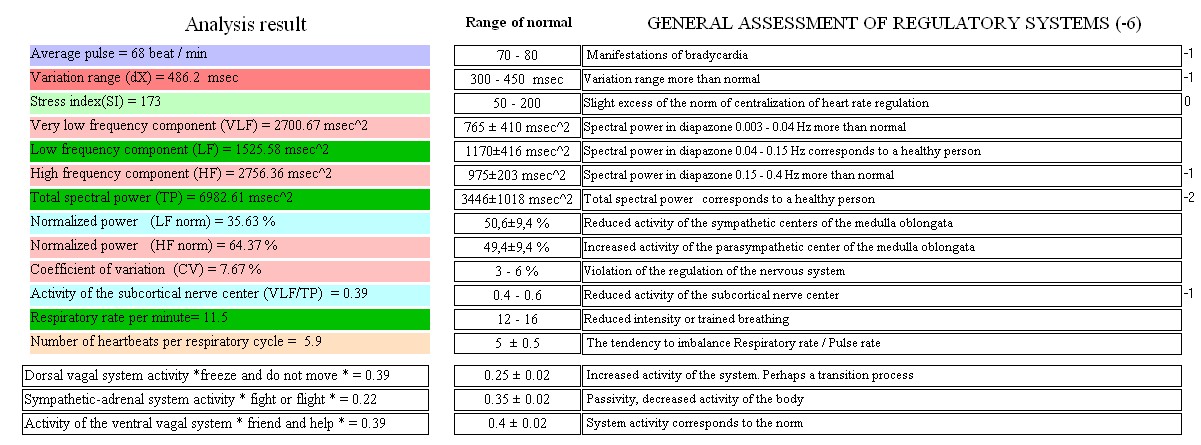
1. The activity of the dorsal vagal complex (the unmyelized part of the vagus) correlates with the power of the very low frequency VLF spectrum present in pulse waves. Corresponds to the state of the body "freeze, do not move, go limp, pretend to be dead" From the point of view of Ayurveda, this is TAMAS-inertia, inactivity, inhibition, stupor.
Characteristic - lazy, indifferent, deceitful
2. The activity of the sympathetic-adrenal system (sympathetic trunks, ganglia) is correlated with the power of the low-frequency LF spectrum present in pulse waves.
Corresponds to the state of the body " fight or flight" From the point of view of Ayurveda, this is RAJAS - action, passion, activity, excitement.
Characteristic-materialistic, passionate, greedy, using other people for their own purposes
3. The activity of the ventral vagal complex (the myelized part of the vagus) is correlated with the high-frequency HF power present in the pulse waves.
Corresponds to the state of the body "make friends, communicate, help"
From the point of view of Ayurveda, this is SATTVA-a state of knowledge, purity, harmony, spirituality
Characteristic - friendly, sociable, tolerant of other opinions.
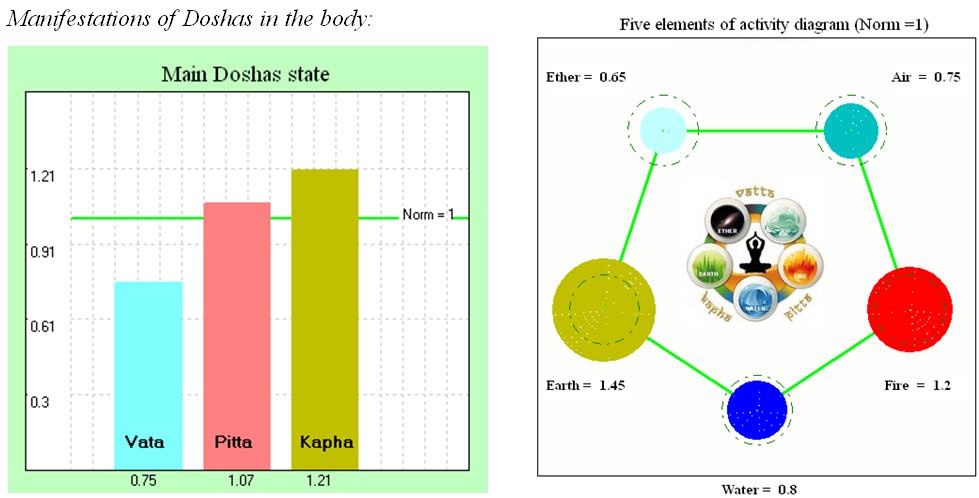
DOSHAS and FIVE ELEMENTS ACTIVITY DIAGRAM
From the idea of the degree of manifestation of each of the three gunas, one can proceed to the idea of the patient's three doshas as a complex of energetic substances. The philosophy of Ayurveda is able to point out the forms of manifestation of various gunas in the doshas - VATA, PITTA, KAPHA. And also display the activity of the "FIVE ELEMENTS"
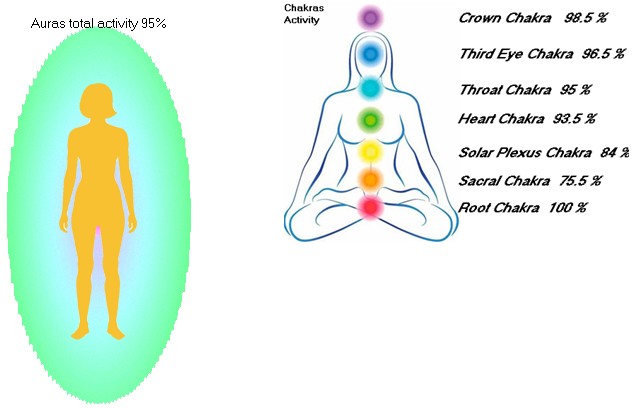
CHAKRAS and AURA ACTIVITY
RECOMENDATION BY AYURVEDA
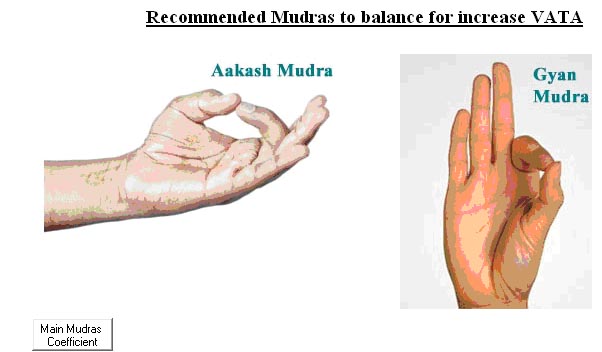
The analytical module of the diagnostic system LifePulsAS can offer some recommendations for restoring the balance of the patient's condition. It can be MUDRAS, MANTRAS and FOOD.
Healing Mudras are hands and fingers arranged in a special way. Mudras are a way of influencing oneself, thanks to which one can find inner peace and health.
Example of recommended Mudras:
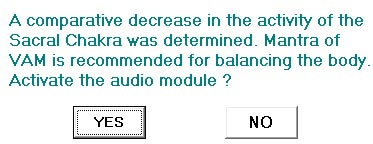
In some cases, the software offers an ambulance to improve the condition if significant deviations from the normal state are detected during the recording of pulse waves.
MANTRAS
According to the results of the assessment of the activity of the chakras, the software offers the most acceptable Mantra for restoring balance.
Example of recommended Mantra
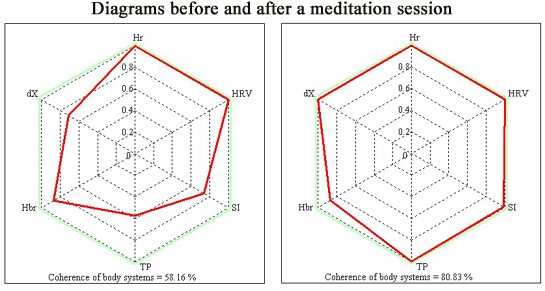
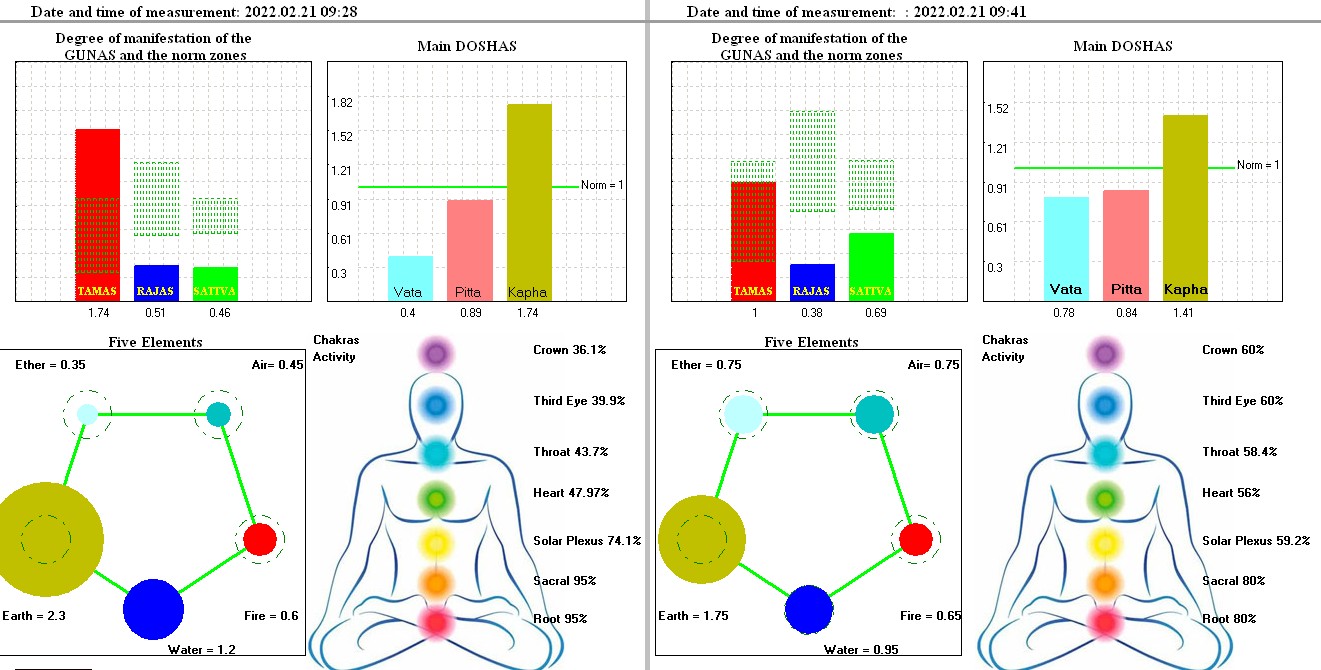
Comparison of two research results according to Ayurveda
The comparison module can display the results of two measurements, for example, before and after any influence on the patient. This, for example, can help in assessing the effect on the patient of therapy procedures , acupuncture, dietary supplements, medications, diet, yoga exercises, meditation, listening to mantras, affirmations, and more.
An example of a comparative analysis of the results before and after listening to the OM mantra
PATIENT'S LIFESTYLE
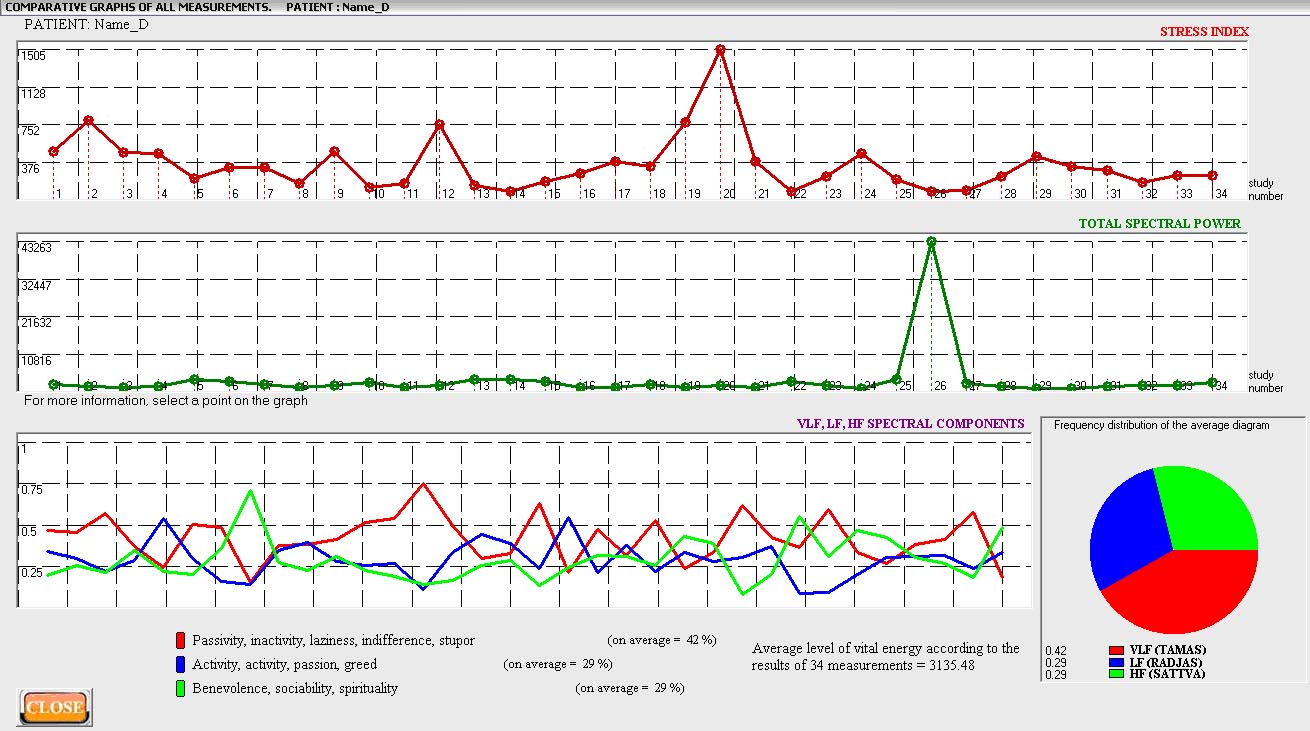
The system allows us to see the basic data of all the studies conducted for a particular patient over a long period of time. For example, in a few weeks. We can see how the stress index changed, the value of the total spectral power of pulse waves, as well as graphs of the three component frequencies in the total spectrum of pulse waves. At the same time, we see the general view and can observe what changes occur from the measurement to next measurement. Separately, an averaged frequencies distribution diagram or gunas is presented, which is an integral characteristic that allows us to see the general lifestyle of the patient.
The proposed diagnostic system LifePulsAS is convenient and easy to use and is a type of express diagnosis and can be useful for all human pulse researchers, practicing doctors and specialists in Ayurveda, as well as people who monitor their health.
Lithuania Vilnius
e-mail: a.safin2019@gmail.com
Copyright © 2022 Aidar Safin. All Rights Reserved.